Get Started with About Us Visualizations
PrinciplesUs allows you to create a view of people and gain insights about that group via three types of visualizations. Specifically,
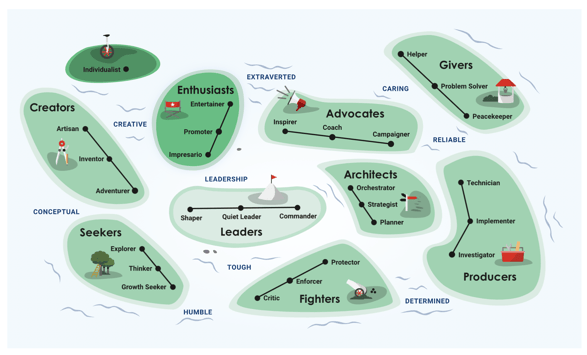
- Archetypes - the group’s collective archetype distribution across 10 “islands”
- Trait Scales - how your group is distributed across the trait scales
- Team Profiles - focus areas that your group may need to consider and where your group falls relative to the ranges of the traits within the selected profile
Continue reading for more information on each of these visualizations. Otherwise, you can get started by creating a view.
Archetypes
In the Archetype visualization, PrinciplesUs uses an archipelago to show the team’s collective archetype distribution across 10 islands. Each island encompasses 3 related archetypes, except for one (Individualist). The proximity of the islands is a general representation of how closely they relate, and the trait names in the water are general indicators of what connects them. For instance, Enthusiasts are connected to Advocates through traits around Extraversion, and to Creators on their other side through traits around Creativity and Originality. These are not precise however, they are meant to be evocative and helpful as you explore the landscape of your own and others’ personality differences.
On the archipelago, darker greens indicate the team has a relatively higher concentration (based on percentile scores) of the archetypes on that island compared to lighter greens which show a lower representation. You can click on each island in the visualization to understand what it means to be on that island and how the members are distributed across the islands (based on their top archetype).

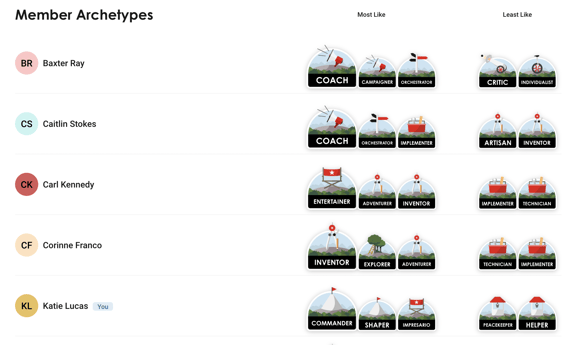
If you scroll down, you can also see the top 3 archetypes (and bottom 3 archetypes) for each member.

Trait Scales
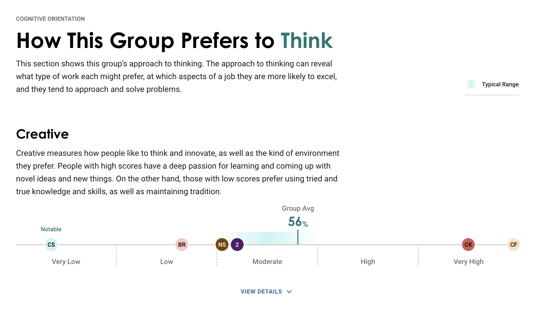
The Trait Scales visualization plots each member’s score across each trait scale. This enables you to see several characteristics of the group at a glance. There will likely be traits your group has in common and others where you differ. Some distributions may provide balance for the group, while others can present challenges. Being aware of how you relate to one another can help you interact most effectively.
For each Trait Scale, you will see a Typical Range that indicates a moderate preference for the trait. If the group as a whole (Group Average) is sufficiently outside the Typical Range, a designation of High Affinity or Low Affinity is marked for the group. An individual’s score is marked Notable when it diverges from the group. To see each individual’s score, simply click ‘View Details.’

Team Profiles
Team Profiles consist of a set of Focus areas that teams might need to consider, or a set of traits that are important for success in a specific context.
Expand any of the profiles to show how the members compare and consider:
- Where your group falls relative to the target ranges of the traits within your desired Team Profile. The traits shown are those that are most relevant to the selected Team Profile.
- When you need to have this focus as a team or group, who might you draw upon for different aspects to be successful.
Follow these steps below to get the most out of Team Profiles:
- Read the Definition to understand what defines that area of focus.
- Consider the Important Traits - read how each Trait connects to that area of focus and why it’s important, e.g. why Creative can be important for a team’s Entrepreneurial focus.
- Discuss with your team
- Overall team preference - as a whole, do you tend higher, lower or balanced?
- Preferences of the individuals on the team - are there people who are notable for their strong preference for a Primary Trait?
- Consider your group strengths and possible Team Challenges. Are there any individuals who you may be able to draw on to balance out the rest? Remember, not everyone on the team must display all of these traits.
- Optionally take a look at the “Leader Characteristics” to think about the ways in which the Leader of your team (if there is one) can enhance the strengths of your team and/or balance some gaps.They can help highlight team “comfort zones” as well as areas that require stretching beyond the team’s natural preferences. They can also identify who you might lean on for specific needs in those contexts.